
Figure 2. Time to exhaustion during the four performance trials.
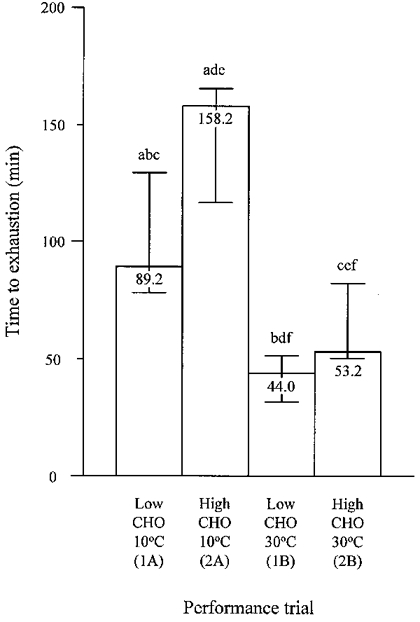
Columns and bars represent median and range. Significant differences between trials are as follows: a, 1A vs. 2A; b, 1A vs. 1B; c, 1A vs. 2B; d, 2A vs. 1B; e, 2A vs. 2B; f, 1B vs. 2B.
Official websites use .gov
A
.gov website belongs to an official
government organization in the United States.
Secure .gov websites use HTTPS
A lock (
) or https:// means you've safely
connected to the .gov website. Share sensitive
information only on official, secure websites.
Columns and bars represent median and range. Significant differences between trials are as follows: a, 1A vs. 2A; b, 1A vs. 1B; c, 1A vs. 2B; d, 2A vs. 1B; e, 2A vs. 2B; f, 1B vs. 2B.