
Figure 2. The variance-mean plot can identify the locus of synaptic modulation when applied to simulated data.
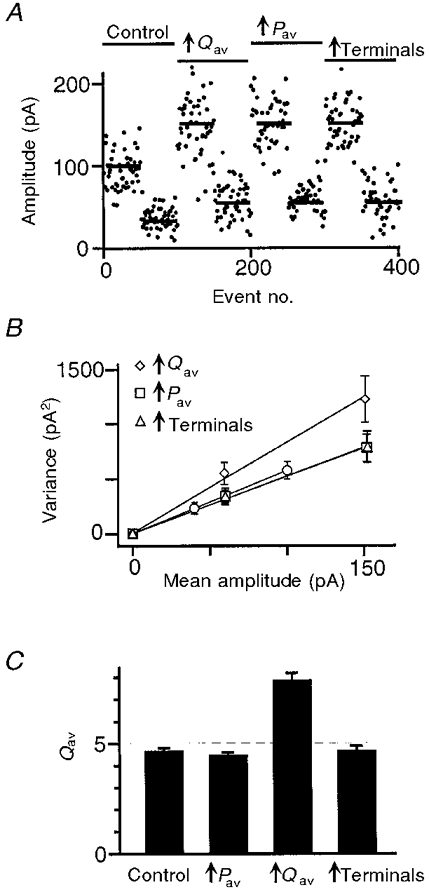
A, simulated EPSC amplitudes plotted against event number. A model of a compound synaptic contact was used to simulate EPSC amplitudes under control conditions and following each of 3 types of modulation: postsynaptic modulation that increased Qav, presynaptic modulation that increased Pav, and modulation that increased the number of active terminals. Under each condition, 50 events were generated before and 50 after the simulated application of Cd2+. B, the average variance-mean plot under control conditions (○), and following each type of modulation: postsynaptic (⋄), presynaptic (□), and increased number of terminals (▵). Error bars indicate ±s.e.m. (n = 20). C, average value of Qav estimated from the slope of individual variance-mean plots under control conditions and following each type of modulation. Error bars indicate +s.e.m. (n = 20). The dashed line indicates the expected value of Qav under control conditions. Only postsynaptic modulation produced a significant change in Qav.