
Figure 4. The variance-mean plot can identify the locus of synaptic modulation when applied to EPSCs recorded from dentate granule cells.
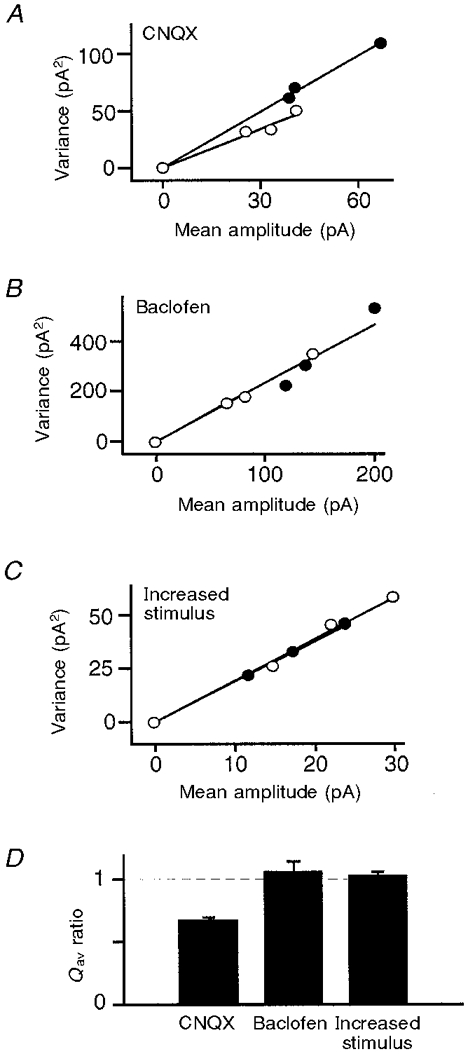
A-C, the variance of the EPSC amplitude is plotted against the mean amplitude during stable epochs at each Cd2+ concentration (0, 2 or 6 μM) before and after a synaptic modulation. A, variance-mean plot before (•) and after (○) the application of CNQX (0.4 μM), a competitive antagonist at postsynaptic AMPA receptors. CNQX reduced the slope of the plot and hence Qav, consistent with a postsynaptic modulation. B, variance- mean plot before (•) and after (○) the application of baclofen (4 μM), which reduces the probability of vesicle release from the presynaptic terminal. There was no change in Qav, consistent with a presynaptic modulation. C, variance-mean plot before (•) and after (○) an increase in the strength of the stimulus to the presynaptic axons. There was no change in Qav, consistent with a presynaptic modulation. D, average change in Qav after the application of CNQX (n = 5), baclofen (n = 5) and an increase in stimulus strength (n = 5). Error bars indicate +s.e.m. Only CNQX produced a significant change in Qav.