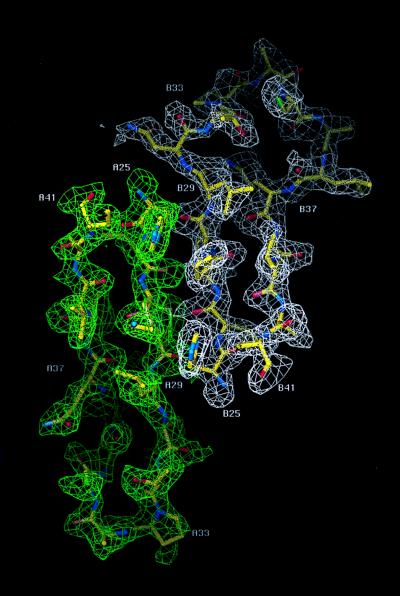
Figure 2.
2Fo-Fc omit map contoured at 1 σ between residues 25 to 41 that make up β strands 1 and 2 and the interconnecting loop. The electron density for monomer 1 (A25 to A41) is drawn in green and monomer 2 (B25 to B41) is drawn in white. This figure was created with the graphics program o (16).

