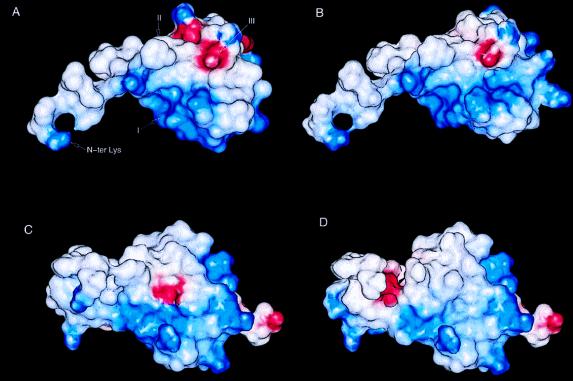
Figure 4.
Electrostatic potential map of (A) the SDF-1α monomer, (B) the gro-α/SDF-1α chimera based on the SDF-1α structure, (C) the gro-α/SDF-1α chimera based on the gro-α structure (27), and (D) gro-α. The chimera for B and C is based on results from Crump et al. (21) and has the sequence KPSVSLSYRC PCRFFESHIH PKNIQHLKIL NTPNCAQTEV IATLKNGRKA CLNPASPIVK KIIEKMLNSD KSN, where the underlined residues are from SDF-1α and the remaining residues are gro-α. The electrostatic potential was calculated by using delphi (Biosym Technologies) and displayed with insightii. For the calculation, lysine and arginine side chains were assigned an overall charge of +1.0, histidine was assigned an overall charge of +0.5, and aspartic acid and glutamic acid were assigned an overall charge of −1.0. The regions of positive potential are shown in blue, and the regions of negative potential in red. In A, region I consists of residues Lys-24, His-25, Lys-27, and Arg-41; region II consists of Pro-10, Phe-13, Val-18, Val-27, Leu-29, Val-39, Leu-42, Val-49; and region III consists of Arg-12, Glu-15, His-17, and Arg-47.

