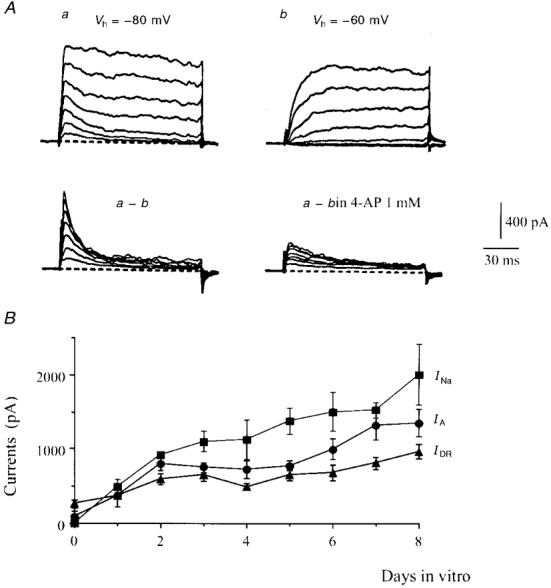
Figure 2. Evolution of INa, IA and IDR during the first 8 days of cell culture.

A, recordings performed in the presence of 30 nM TTX. Outward currents elicited at DIV2 by voltage pulses from -40 to 20 mV applied from two holding potentials, Vh = -80 mV (a) and Vh = -60 mV (b). The fast transient A-current was isolated by subtracting series b from series a. This current was partially blocked (64%) by 1 mM 4-AP. B, amplitude (mean ±s.e.m., n = 4 to 10 experiments) of INa, IDR and IA peaks at various days of growth. IA and IDR were recorded at +20 mV, and INa at -30 mV.
