
Figure 2. The effects of [Ca2+]o on [Ca2+]i responses to focal applications of caffeine in cells pretreated with thapsigargin.
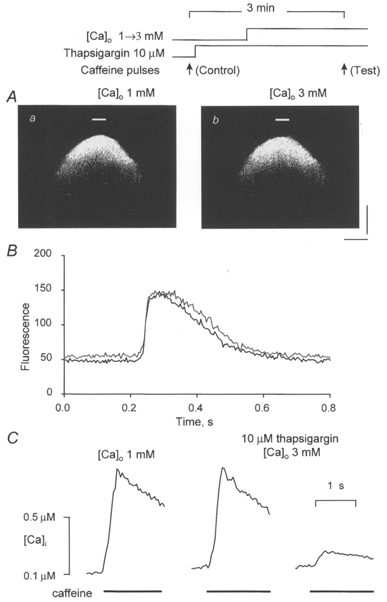
A, linescan images of fluorescence changes induced by focal applications of caffeine (10 mM) in the presence of 1 mM [Ca2+]o (a) and 2 min after increasing [Ca2+]o to 3 mM (b). Thapsigargin (10 μM) was introduced into the bath 1 min prior to elevating [Ca2+]o. The experimental protocol is presented schematically at the top. Calibration bars: horizontal, 18 μm; vertical, 0.64 s. B, time-dependent changes in fluorescence at the site of caffeine applications (marked in Aa and b by bars) at 1 mM [Ca2+]o (black trace) and 3 mM [Ca2+]o (grey trace). C, caffeine-induced Ca2+ transients measured before and after successive applications of thapsigargin and 3 mM Ca2+ to the bath. Caffeine (20 mM) was applied for 2 s. The lefthand trace is the control ([Ca2+]o = 1 mM). The middle trace was recorded 3 and 2 min after introduction to the bath of thapsigargin (10 μM) and elevated Ca2+ (3 mM), respectively. The righthand trace was acquired 2 min after the middle trace in the continuous presence of thapsigargin and 3 mM Ca2+.