
Figure 3. The effects of thapsigargin on [Ca2+]i responses to focal applications of caffeine in cells preloaded with Ca2+ above normal levels.
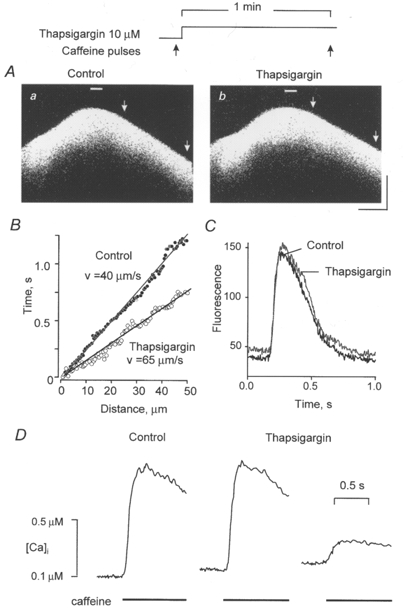
A, linescan images of fluorescence changes induced by focal applications of caffeine (10 mM) before (a) and 2 min after introducing of 10 μM thapsigargin to the bath (b). [Ca2+]o was 3 mM. Calibration bars: horizontal, 18 μm; vertical, 0.66 s. B, linear fits to the positions of the wave in Aa (•) and b (○) in sections defined by the arrows; the values of mean wave velocities are indicated next to the respective linear fits. C, time-dependent changes in fluorescence at the sites of caffeine application (marked in Aa and b by bars) in the presence (black trace) and absence (grey trace) of thapsigargin. D, Ca2+ transients induced by applications of caffeine before (lefthand trace) and after introduction to the bath of 10 μM thapsigargin (middle and righthand traces). Caffeine (20 mM) was applied to the bath for 2 s at 2 min intervals; thapsigargin was applied 1 min prior to the second addition of caffeine.