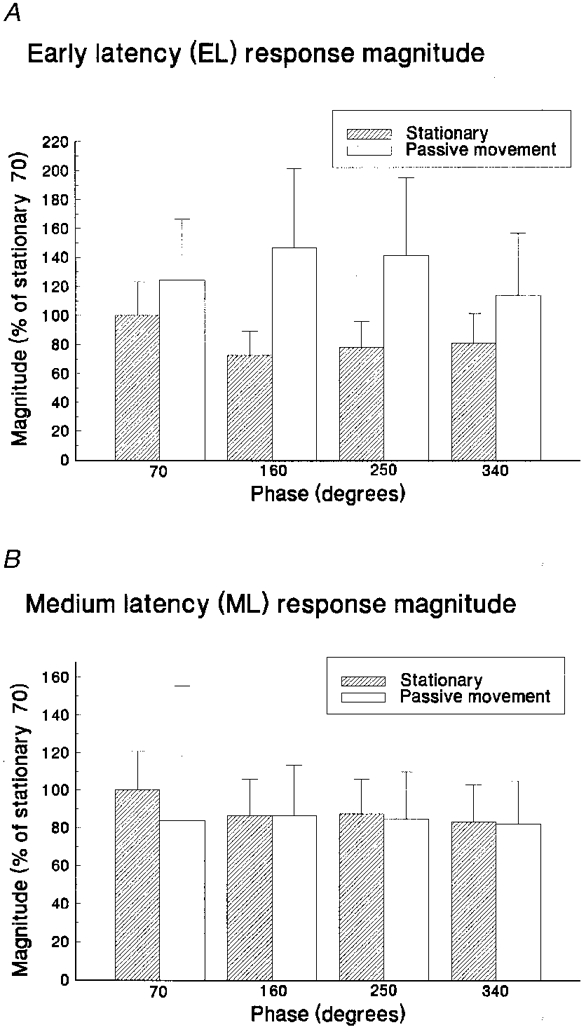
Figure 3. Movement phase effects on reflex magnitudes.

Average reflex magnitudes (and standard deviations) for stationary and passive movement task conditions measured at different phase positions (360 deg, fullest flexion; 180 deg, fullest extension). Excitatory (EL) and inhibitory (ML) reflex magnitudes are displayed in A and B, respectively. Responses are expressed as a percentage of the average magnitude measured at 70 deg during stationary control trials.
