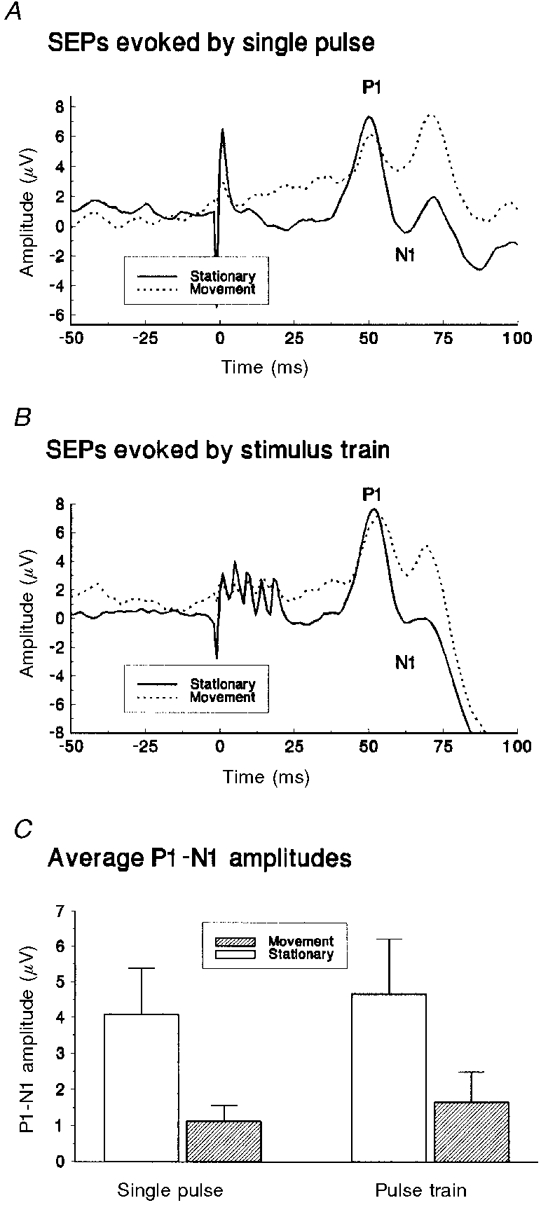
Figure 5. Passive movement effects on sural nerve SEP magnitudes.

Average somatosensory evoked potentials from sural nerve stimulation, measured from a single subject for movement and non-movement (stationary) task conditions. Responses following a single pulse and those from a train of stimuli are shown in A and B, respectively, with 0 ms indicating the start of stimulation. C, averaged P1-N1 response magnitudes for a group of four subjects, following single and train pulses for movement and non-movement (stationary) task conditions.
