
Figure 2. Characteristics of the non-inactivating, E-4031-insensitive K+ current in rat lactotrophs.
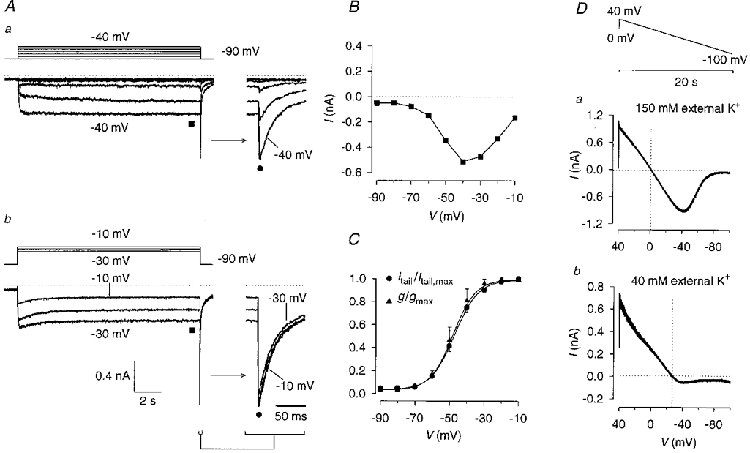
Aa and b, membrane currents were recorded in the presence of 10 μM E-4031 from a holding potential of -90 mV with 14 s depolarizing test pulses to membrane potentials between -80 and -10 mV in steps of 10 mV. B, steady-state inward currents shown in A (▪) plotted versus membrane potential. C, activation curves. Tail current amplitudes recorded upon repolarization to -90 mV (Aa and b) were normalized to the maximal tail current amplitude and plotted versus prepulse potential (•). Mean values were fitted with a Boltzmann function (V½= -47·0 mV, slope factor k= 6·8 mV). In addition, the conductance was calculated from the steady-state current amplitudes shown in B with the potassium equilibrium potential EK= 0 mV, normalized to the maximal conductance and plotted versus test pulse potential (▴; V½= -47·9 mV, k= 6·5 mV). Error bars denote s.e.m. (n= 6). D, determination of the reversal potential of the non-inactivating K+ current measured in 150 mM (a) and 40 mM (b) K+ external solution in the presence of 10 μM E-4031. Current recordings from two different cells. The pulse protocol consisted of a 20 s voltage ramp from 40 to -100 mV. Holding potential, 0 mV. Reversal potentials are indicated by vertical dotted lines.