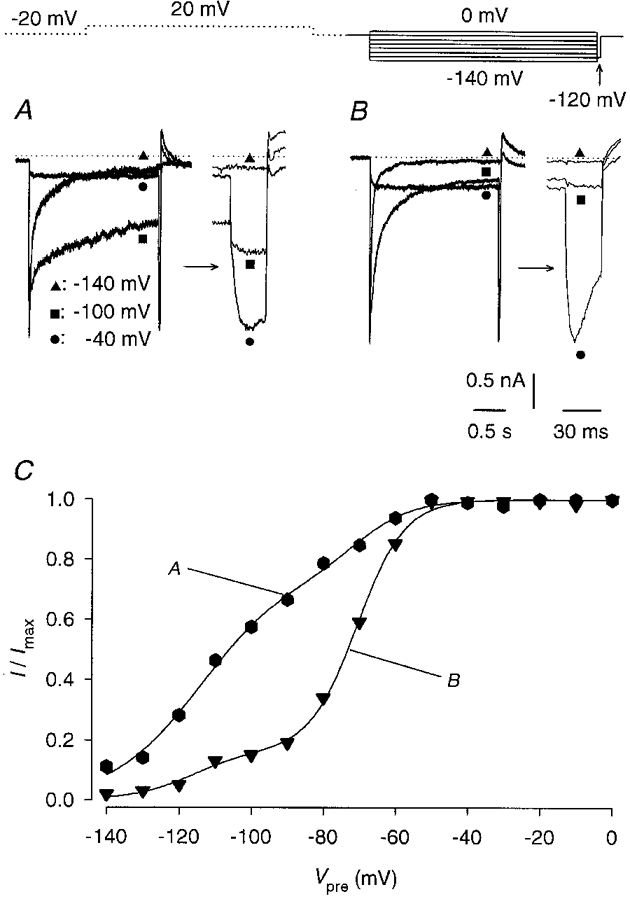
Figure 5. Potential-dependent availability of the erg-like K+ current.

Membrane currents were recorded with a constant 30 ms test pulse to -120 mV preceded by 2 s pulses to membrane potentials between 0 and -140 mV in steps of 10 mV before and after application of 10 μM E-4031. A 2 s pulse to 20 mV preceded the differing prepulses to reduce the time interval necessary for measuring maximal inward currents. This pulse was separated by 0·5 s from the prepulses. The interval between the -120 mV test pulses was 20 s; the holding potential was -20 mV. Two experiments were selected where the E-4031-sensitive current exhibited a predominantly slow (A) or fast (B) time course of deactivation. Three current traces elicited with potential steps to -40, -100 and -140 mV are given. Membrane currents elicited by the hyperpolarizing test pulse are shown separately on an expanded time scale. C, potential-dependent availability curves from the experiments shown in A and B. Peak inward currents recorded during the test pulses were normalized to the maximum current (I/Imax) and plotted versus prepulse potential. Data points were fitted with the sum of two Boltzmann functions. The curves indicated by A and B represent experiments 1 and 11 given in Table 1.
