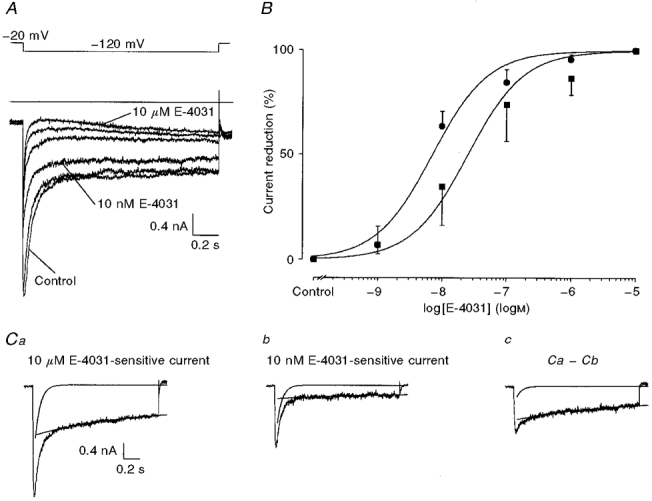
Figure 7. Dose-response relationship between E-4031 and the two current components of the erg-like K+ current.

A, membrane currents elicited in 150 mM K+ external solution with a 1·5 s potential step to -120 mV from a holding potential of -20 mV. The test pulse was preceded by a 2 s pulse to 20 mV separated by a gap of 0·5 s. Test pulses were applied every 20 s and the E-4031 concentration was increased after every 9th test pulse. Membrane currents recorded in the presence of different E-4031 concentrations are superimposed. B, dose-response curve for E-4031. Membrane currents recorded in the presence of 10 μM E-4031 were subtracted from the last membrane currents recorded before increasing the E-4031 concentration. The deactivation of the resulting currents was fitted with the sum of two exponential functions. The amplitudes of the fast and slow components were related to the 10 μM E-4031-sensitive current; the drug-induced mean current reduction ±s.d. was plotted versus E-4031 concentration and fitted with the Hill function. The resulting KD values were 7·1 nM for the fast component (•) and 25·1 nM for the slow component (▪). Ca, 10 μM E-4031-sensitive current obtained by subtraction of the current recorded in the presence of 10 μM E-4031 from the control current. Cb, current sensitive to 10 nM E-4031 obtained by subtraction of the current recorded in the presence of 10 nM E-4031 from the control current. Cc, current obtained by subtraction of the current trace shown in Cb from that in Ca. The decay of all currents was fitted with the sum of two exponentials. The two exponential functions are plotted separately.
