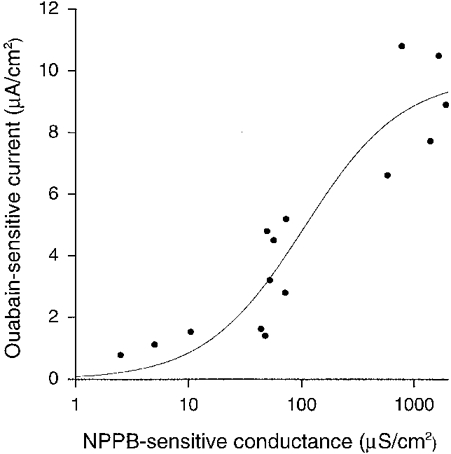
Figure 10. Correlation between NPPB-sensitive conductance and ouabain-sensitive current.

The ouabain-sensitive current did not increase linearly against the NPPB-sensitive conductance. The relationship between the NPPB-sensitive conductance and the ouabain-sensitive current was fitted by a Michaelis-Menten equation. The estimated value of the maximum ouabain-sensitive current (Im) was 9·8 μA cm−2; the conductance showing the half-maximum ouabain-sensitive current (Km) was estimated to be 104·3 μS cm−2. The continuous line is drawn by the equation with these values (Im of 9·8 μA cm−2, Km of 104·3 μS cm−2). Correlation coefficient = 0·86. The data fitting was done with a non-linear least-squares method.
