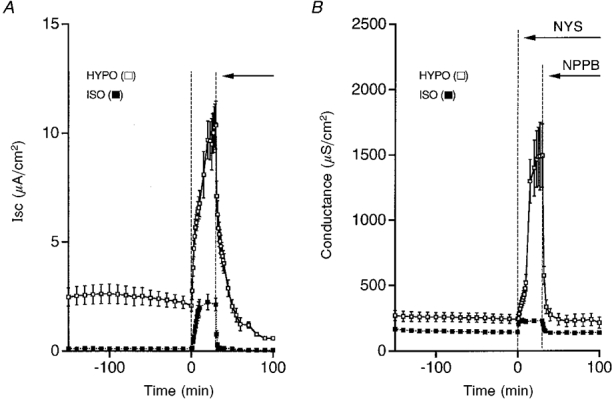
Figure 11. Time courses of Isc and conductance after exposure of cells to a hyposmotic or isosmotic solution.

A, nystatin (NYS, 50 μM, apical application) increased Isc, but the magnitude of the increased Isc was much larger in a hyposmotic solution (□) than that in an isosmotic solution (▪). The ouabain-sensitive current was also much larger in a hyposmotic solution (□) than that in an isosmotic solution (▪). B, nystatin increased the conductance in both hyposmotic and isosmotic solutions, but the nystatin-induced increase in conductance was much larger in a hypotonic solution (□) compared with that in an isosmotic solution (▪). The NPPB-sensitive conductance was much larger in a hyposmotic solution (□) than that in an isosmotic solution (▪). n = 4-8.
