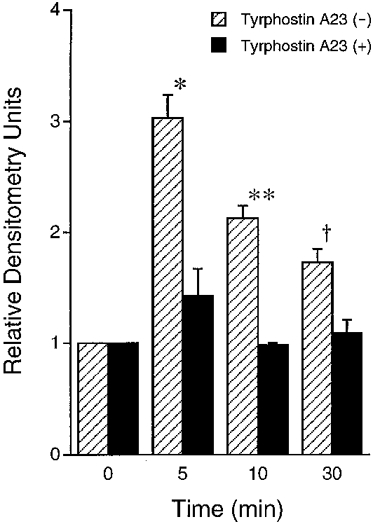
Figure 16. Quantified results of tyrosine phosphorylation in proteins of around 60 kDa with an imaging densitometer.

In the absence of tyrphostin A23 ( ), hyposmotic stress increased phosphotyrosine with a peak around 5 min after application of hyposmotic stress followed by a decline of phosphotyrosine. The amount of phosphotyrosine at 5, 10 and 30 min after application of hypotonic stress in the absence of tyrphostin A23 was larger than the basal amount at 0 min (* P < 0·01, **P < 0·01 and †P < 0·025 compared with 0 min). In the presence of TY23 (100 μM, bilateral application; ▪), hypotonic stress did not significantly increase the amount of phosphotyrosine; i.e. the amount of phosphotyrosine at 5, 10 or 30 min was not significantly different from that at 0 min. n = 3.
