
Figure 5. Development of and recovery from fast inactivation.
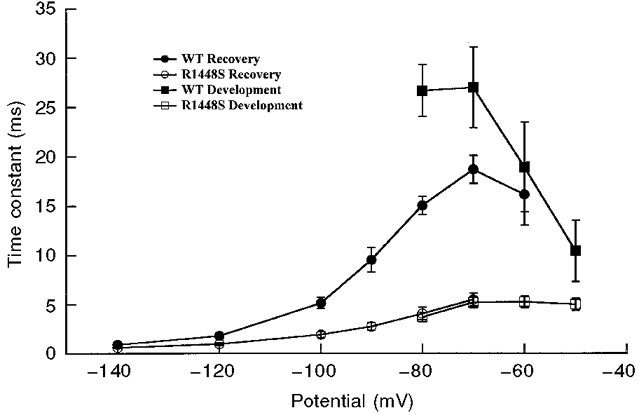
Development of fast inactivation and recovery from fast inactivation. The time constants for development of fast inactivation (squares) and recovery from fast inactivation (circles) are plotted as a function of voltage. Development of inactivation: cells were held at -100 mV, followed by a prepulse ranging from -80 to -50 mV for increasing durations, then stepped to -20 mV to determine the fraction of current inactivated during the prepulse for WT (▪) and R1448S (□). Recovery from fast inactivation: cells were prepulsed to -20 mV for 20 ms to inactivate all of the current, then brought back to potentials from -140 to -60 mV for increasing recovery durations prior to the pulse to -20 mV to assay the fraction of current recovered, for WT (•) and R1448S (○). The time constants were determined by fitting a single-exponential function to plots of peak amplitude during the test pulse versus prepulse duration. The maximum pulse rate was 0·5 Hz.