
Figure 6. hSkM1 WT and R1448S mutant channel slow inactivation.
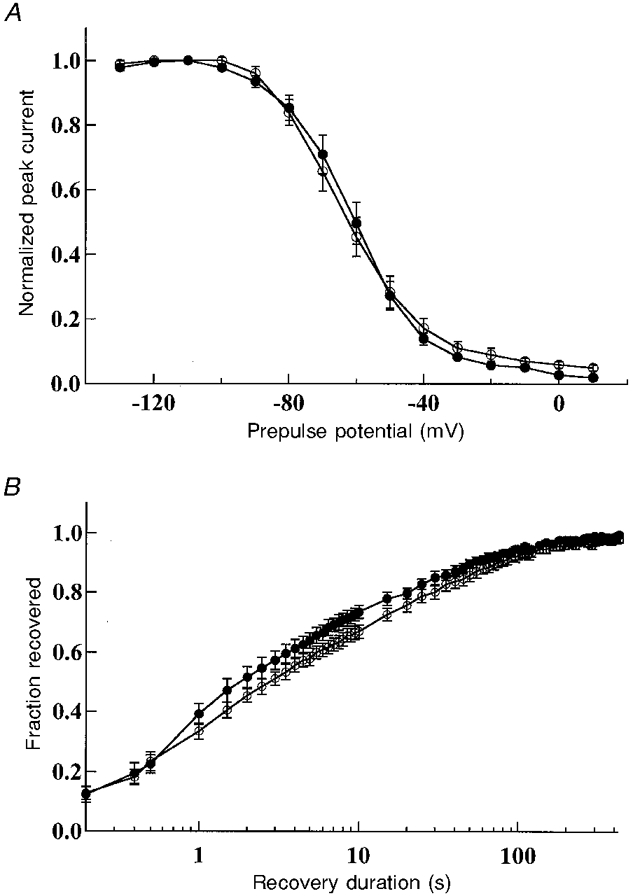
A, steady-state slow inactivation. Cells were held at potentials starting from -130 mV and increasing to 10 mV in 10 mV steps. After 50 s at each holding potential, a 30 ms recovery pulse to -100 mV and a 20 ms test pulse to -10 mV were given before the holding potential was incremented. The peak current elicited by the test pulse to -10 mV is plotted as a fraction of the maximum current for WT channels (•, n= 11) and R1448S channels (○, n= 8). B, slow inactivation recovery. The pulse protocol used has been described previously (Cummins & Sigworth, 1996). Data are means ±s.e.m. (WT: •, n= 9; R1448S: ○, n= 8).