
Figure 1. Localization of sites of injection of IL-1ra.
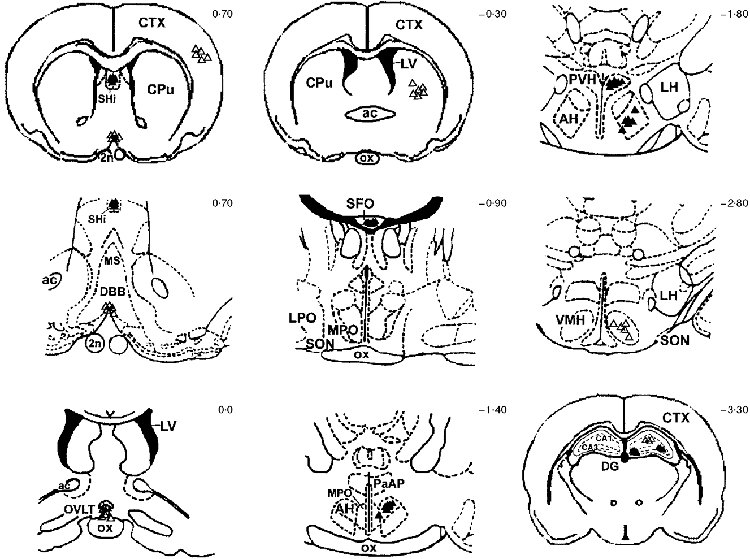
Frontal sections of the rat brain showing the distribution of individual sites microinjected with 0·5 μl saline or 50 μg hrIL-1ra in 0·5 μl, at time 0 h and 1 h, illustrated according to the magnitude of the suppression in body temperature in response to LPS i.p.o. and hrIL-1ra into a particular brain site. ▵, < 0·5 °C; ▴, > 0·5 °C. CPu, caudate putamen (striatum); CTX, cortex; SHi, septohippocampal nucleus (peri-subfornical organ); ac, anterior commissure; MS, medial septal nucleus; DBB, diagonal band of Broca; 2n, optic nucleus; OVLT, organum vasculosum lamina terminalis; LV, lateral ventricle; ox, optic chiasm; SFO, subfornical organ; LPO, lateral preoptic area; MPO, medial preoptic area; SON, supraoptic nucleus; AH, anterior hypothalamus; PaAP, paraventricular hypothalamus, anterior part; PVH, paraventricular hypothalamus; LH, lateral hypothalamus, VMH, ventromedial hypothalamus; DG, dentate gyrus, CA1 & CA3, fields of the hippocampus. The numbers on the right of the individual frontal sections indicate the distances in millimetres from bregma (based on the anterior-posterior orientation of Paxinos & Watson, 1986).