
Figure 1. Illustration of the method of rod isolation for an a-wave family.
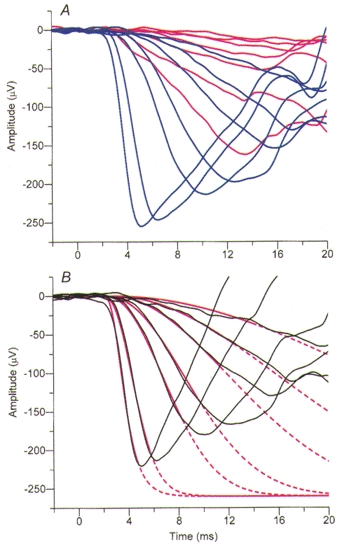
Rod isolation was achieved in the light adaptation experiments by recording responses to photopically matched blue and red flash stimuli and subsequently subtracting the red (cone) responses from the blue (rod + cone) responses. A, averaged responses for a standard family (Table 1) of photopically matched blue and red flashes, under dark-adapted conditions in subject FD. The trace colours correspond to the flash colour presented. B, subtraction of the red traces from the blue traces in A gives the rod-isolated family (black traces). The smooth red curves plot the best fitting ensemble of predicted responses for the full model of transduction; these curves are shown as continuous over the range of times for which the fitting was applied at each flash intensity, and are continued as dashed thereafter. The parameters used were: membrane time constant, τ= 0·9 ms; pure delay, td= 1·8 ms; maximal response, amax= -260 μV. The amplification constant obtained from the fitting was A= 5·8 s−2. For this subject the dilated pupil diameter was 7·2 mm.