
Figure 6. Recovery of normalized parameters following a full bleach.
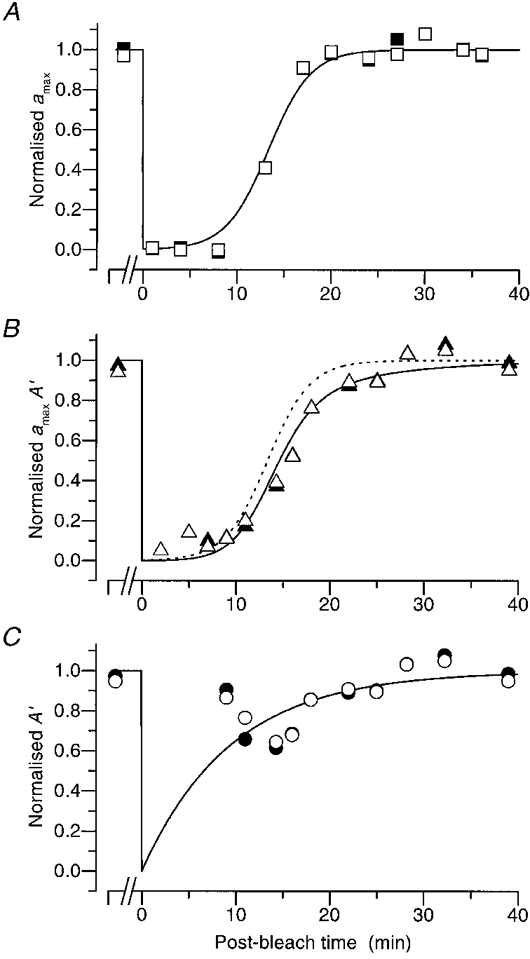
Normalized values of the parameters of transduction, estimated using our two approaches, are plotted for another subject (FD) following a full bleach, using the same symbols as in Fig. 5. A, ▪, amax; B, ▴, product amaxA′; C, •, apparent amplification constant A′; each was determined from the first approach (iterative fitting of the rising phases). The corresponding open symbols are the estimates obtained by the second approach (measurement at fixed time). The continuous curves are as Fig. 5, with ca= 375, τa= 2·25 min, and τRh= 9·5 min. In order to make apparent the delay between the recovery of amax and of the product amaxA′, the curve from panel A has been redrawn in panel B as the dashed curve. In this experiment the pre-bleach estimates were based on measurements made between 10 and 12 min prior to delivery of the bleach.