
Figure 9. Conversion to ‘equivalent background intensity’.
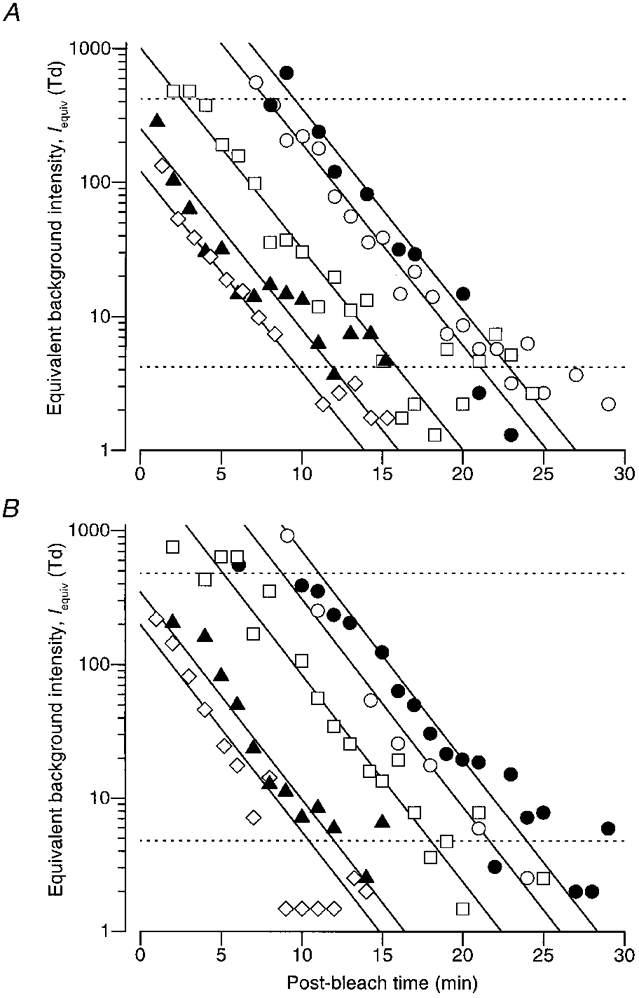
The results from panels B and C of Fig. 8 have been converted to ‘equivalent background intensity’ using the measured light adaptation results for the same subjects; i.e. the ‘Crawford transformation’ has been applied to them. The dashed horizontal lines indicate levels of 1 log unit above and below the value of I0 for the two subjects, and delineate the range within which the results will be most reliable. The continuous straight lines plot eqn (11), using the parameters tabulated in the legend to Fig. 8.