
Figure 2. Short-latency excitation in an SA II afferent.
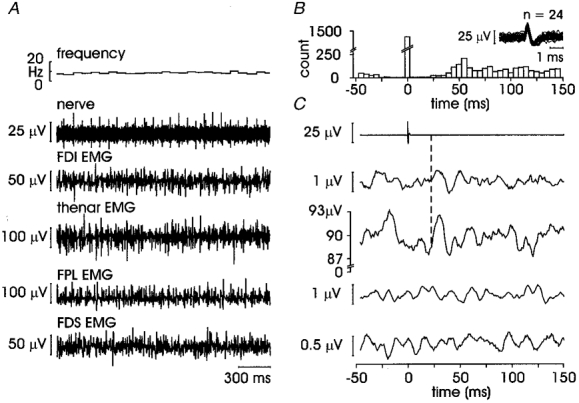
A, raw data for unit 3 in Table 1 with instantaneous frequency in top trace, neurogram in second trace and four EMG traces below; B, autocorrelogram of the afferent spikes; superimposed spikes in inset; C, averaged data from 2878 sweeps; dashed line to second trace indicates onset latency for response in thenar EMG (22.5 ms).