
Figure 4. Ectopically discharging unit showing a short-latency inhibition, followed by a long-latency excitation.
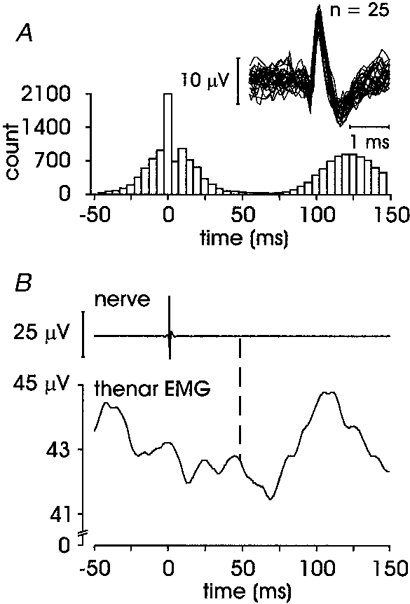
Unit 7 in Table 1. A, afferent autocorrelogram and superimposed spikes; B, averaged data from 9027 sweeps with short-latency onset 46.3 ms and long-latency onset 78.8 ms.