
Figure 5. FA I afferent showing short-latency excitation and inhibition, and long-latency excitation.
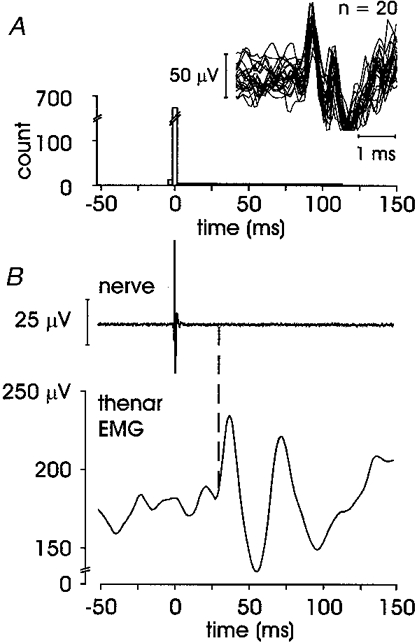
Unit 2 in Table 1. A, afferent autocorrelogram and superimposed spikes; B, averaged data from 1347 sweeps, short-latency excitation onset at 29.4 ms, short-latency inhibition at 44.2 ms and the long-latency excitation at 63.8 ms.