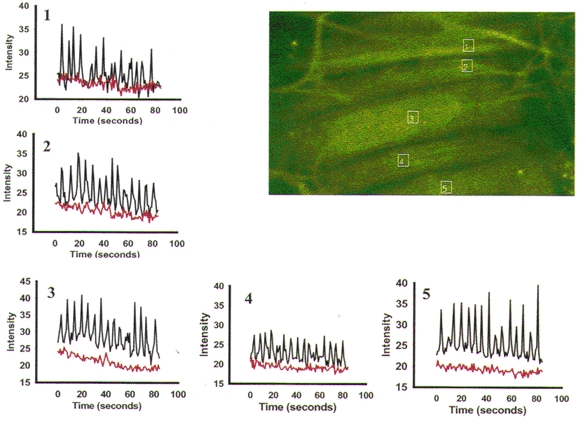
Figure 5. PE-induced Ca2+ oscillations in the presence of nifedipine.

This representative Calcium Green-1-loaded artery developed myogenic tone (49 % of p.d. at 70 mmHg) and constricted in response to 1 μM PE (21 % of p.d.). After application of 1 μM nifedipine in the presence of PE the artery dilated to 98 % p.d. Confocal imaging began after the artery had dilated to a new steady-state diameter. The boxes are the AOI (1-5) measured during exposure to PE and nifedipine. Because the artery was near-maximally dilated by nifedipine and there was no vasomotion, it was possible to record from the same cell and AOI after the application of 20 μM of the SR Ca2+ pump inhibitor CPA. PE-induced [Ca2+] oscillations persisted (black tracing) despite the presence of nifedipine and near-maximal dilatation. CPA immediately abolished the [Ca2+] oscillations (red tracing) in all cells observed.
