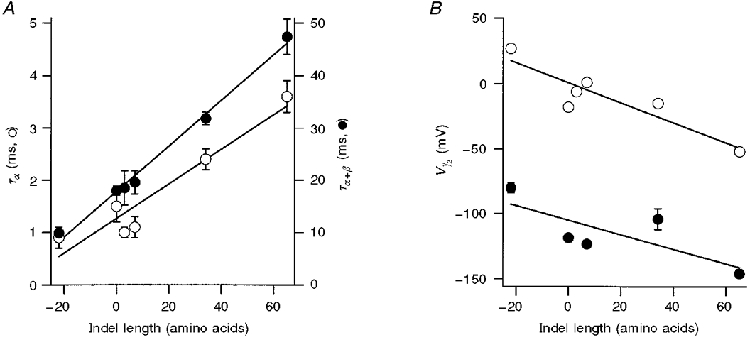
Figure 5. Dependence of KCa channel properties on size of the amino acid insert or deletion (indel length).

A, time constants of current relaxation at -50 mV plotted versus the number of amino acids inserted or deleted at SS1 and SS2 splice sites. ^ (left-hand ordinate): α-subunit alone, 5 μM Ca2+; • (right-hand ordinate): α+β-subunits, 2.5 μM Ca2+. Straight lines are least-squares fits with slope (in milliseconds per amino acid; ms AA−1) and regression coefficient: α: 0.033 ms AA−1, 0.953; α+β: 0.436 ms AA−1, 0.996. B, V½versus the number of amino acids inserted or deleted at SS1 and SS2 splice sites. ^, α-subunit alone; •, α+β-subunits. V½ values were obtained by fitting Boltzmann relationships (see Fig. 4) to tail current amplitudes in 5 μM Ca2+. Straight lines are least-squares fits of slope (in millivolts per amino acid; mV AA−1) and regression coefficient: α: -0.77 mV AA−1, 0.905; α+β: -0.56 mV AA−1, 0.77. All points are means ± 1 s.e.m. The number of measurements averaged for each variant and mean values for Boltzmann slope factor, Vε (in mV), respectively, were: 4:-26 α: 12, 16.6; 0:0 α: 9, 19.8; 0:3: 6, 17.2; 4:3 α: 5, 17.2; 31:3 α: 5, 19.9; 4:61 α: 10, 20.0; 4:-26 α+β: 9, 22.2; 0:0 α+β: 3, 24.1; 4:3 α+β: 3, 24; 31:3 α+β: 6, 23; 4:61 α+β: 5, 19.
