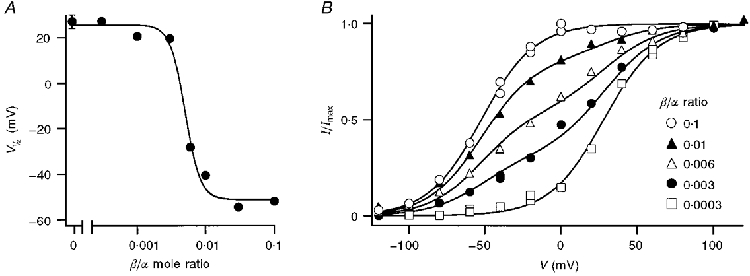
Figure 6. Titration of the shift in voltage sensitivity of the 4:-26 isoform with concentration of β-subunit.

A, V½ of macroscopic currents in 5 μM Ca2+ for patches from oocytes injected with different mole ratios (R) of β-subunit to 4:-26 α-subunit cRNA. V½ values were obtained by fitting Boltzmann relationships (see Fig. 4) to tail current amplitudes, each point being the mean of two measurements. The mean value (± 1 s.e.m.) for the pure α-subunit alone is included for comparison and a smooth curve has been drawn through the points. Owing to differences in the time course of expression of the β- and α-subunits, all measurements on the titration curve were performed at the same time after mRNA injection in the same batch of oocytes. B, examples of voltage-activation relationships in 5 μM Ca2+ for the 4:-26 α-isoform in the presence of different amounts of β-subunit. Current, I, normalized to its maximum value, Imax, was plotted against membrane potential. For the extreme β/α mole ratios each set of points was fitted with a single Boltzmann relationship: B =I/Imax= 1/(1 + exp(V½ - V)/Vε). For R = 0.0003, identical to pure α (Bα), V½= 28 mV, Vε= 17.8 mV. For R = 0.1, corresponding to maximal effect of β (Bα+β), V½= -58 mV, Vε= 17 mV. The three intermediate mole ratios were fitted with: fBα+ (1 - f)Bα+β, where f = 0.19 (R = 0.01), 0.45 (R = 0.006) and 0.69 (R = 0.003). The results indicate the presence of only two species of channel, composed of α alone or α fully affected by β.
