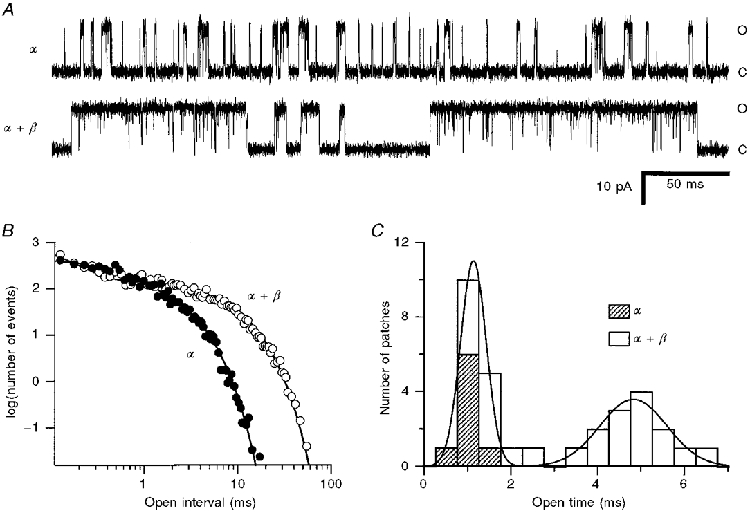
Figure 7. Effects of co-expression of β-subunit on 4:-26 α-subunit channels.

A, single-channel records at -50 mV for pure α- and α+β-subunits. Ca2+ concentrations, chosen to give similar probabilities of opening (≈0.2) in the two recordings, were: α, 15 μM; α+β, 2.5 μM. Note that channel events with β-subunit consist of long bursts of openings interrupted by very brief closures. Closed and open levels are indicated by C and O, respectively. B, open time distributions of α- and α+β-subunit channels shown in A, the ordinate scale denoting the number of events per 25 μs bin derived from recordings 50 s in duration. To compensate for differences in numbers of events in the two recordings, the data for the α+β-channel were multiplied by 6.1 to superimpose the distributions at short intervals. Smooth lines are maximum likelihood fits to sums of two components with time constants of 0.40 and 1.6 ms (α) and 0.13 and 5.8 ms (α+β). C, mean open times of channels derived from oocytes injected with α-subunit alone ( ) and oocytes injected with α+β-subunits at β/α mole ratios of 0.003-0.1. Only the slow component of the open time is plotted. The smooth curve is the fit with the sum of two Gaussians with mean ± 1 standard deviation of 1.1 ± 0.4 and 4.8 ± 1.1 ms, respectively.
