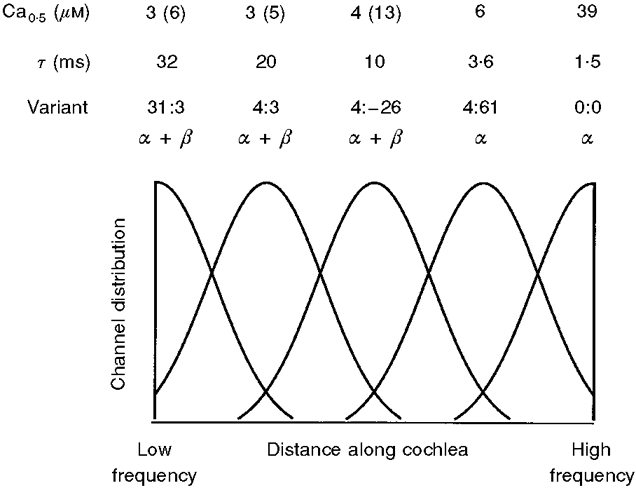
Figure 9. Hypothetical distribution of KCa channel subunits to account for the tonotopic organization of the turtle cochlea.

The hair cell concentration of each isoform is plotted against distance along the cochlea from the low-frequency end. Only the 31:3 α+β, 4:3 α+β, 4:-26 α+β, 4:61 α, and 0:0 α variants are shown, calculated as overlapping Gaussian distributions in decreasing order of time constant. Experimental values for the relaxation time constant (τ) and half-saturating [Ca2+] (Ca0.5) at -50 mV for the different variants are shown above the plot. The Ca0.5 values given in parentheses were obtained for the avian β2; all other values are for bovine β. Evidence in support of the scheme is described in the text.
