
Figure 3. The shape of the stimulus-response curve changes when the model MN starts firing.
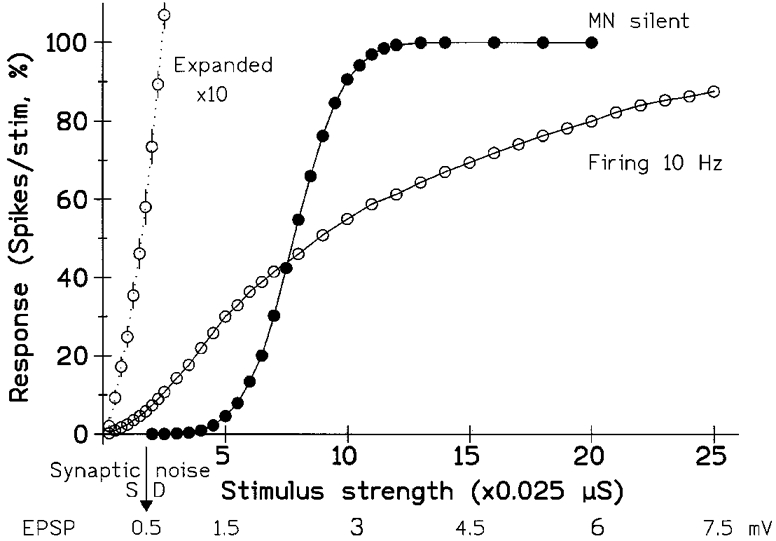
The stimulus consisted of a pulse of increased excitatory conductance, mimicking a synaptic input. The abscissa shows both the conductance change and the peak size of the resulting depolarization (approx. linearly related over range studied). The ordinate gives the response of the unit, determined from the PSTH; it shows the number of extra spikes, above the resting level, produced by the stimulus and is expressed as the percentage probability of the unit responding to the stimulus (i.e. the increase in its ‘firing index’). •, tonic synaptic input insufficient to produce background firing (maximum response then 100). ^, background firing at 10.0 Hz (the super-added response would now saturate at 99, since the unit had a 1 % probability of firing spontaneously in the 1 ms bin tested). The initial part of the 10 Hz curve is also plotted with a 10-fold expansion of the vertical scaling (20 % on scale = 2 %); the standard error bars are now visible (otherwise smaller than points for both plots). The arrow (bottom) indicates the s.d., in millivolts, of the synaptic noise. With the MN firing and using the present number of stimuli (approx. 5000) responses down to 0.5 % were significant; this minimal response was elicited by an EPSP of 0.1 mV or 20 % of the noise. In contrast, the quiescent MN required an EPSP of over 1 mV to give a similar minimal response of 0.5 %. However, with large EPSPs/stimuli the transition from silence to firing reduced the response of the MN. (Background excitatory conductances, 0.205 and 0.245 μS giving noise s.d.s of 0.52 and 0.54 mV with fixed inhibition of 0.2 ± 0.02 μS; noise and EPSP voltages measured with mean membrane potential held at threshold by injecting steady current and inactivating spiking.)