
Figure 1. Stable expression of CCE1 in CHO cells.
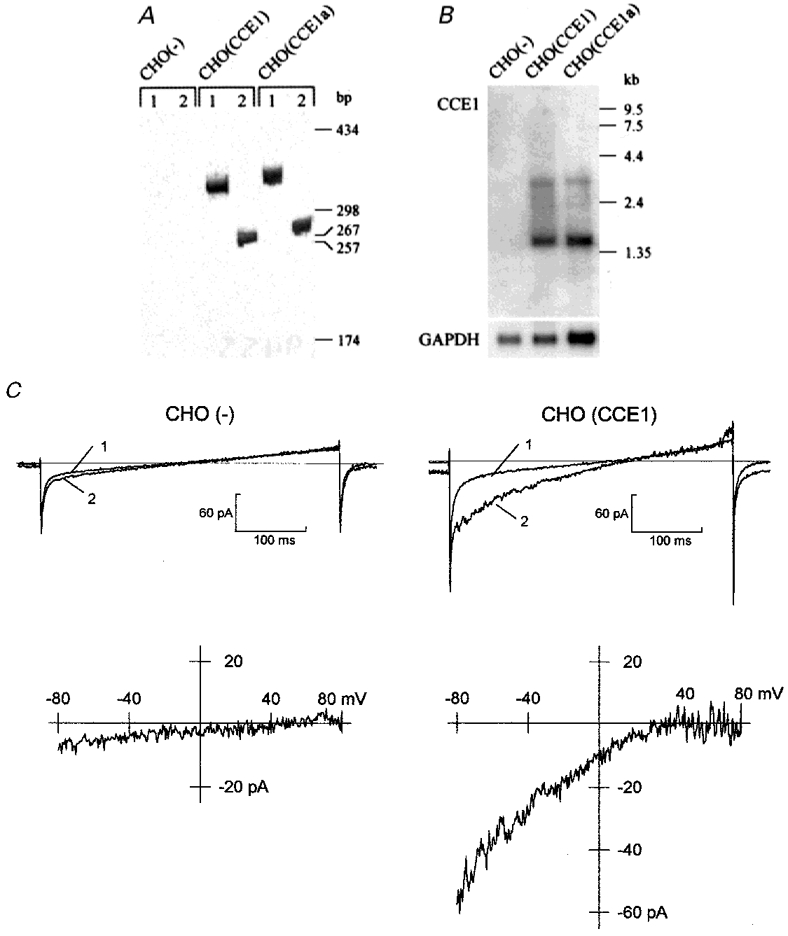
A, RT-PCR analysis of parental (CHO(-)) and bCCE1-transfected (CHO(CCE1), CHO(CCE1a)) cells. PCR primers were specific for the selection marker DHFR (1) and for bCCE1 (2). B, Northern blot analysis of CCE1 and GAPDH (glyceraldehyde-3-phosphate-dehydrogenase) expression. C, activation of ionic currents in CHO(-) and CHO(CCE1) cells by internal dialysis of 10 μM IP3. Ionic currents were elicited every 5 s by voltage-clamp ramps (400 ms) from -100 to +100 mV delivered from a holding potential of 0 mV. Leak currents (1) were collected at the start of dialysis and enhanced currents (2) after IP3 dialysis. Current-voltage relationships (lower panels) were obtained by subtracting leak currents from activated currents. Cm: 15 pF (left) and 20 pF (right). The internal dialysate contained 115 mM Cs+ and 10 mM EGTA. The external solution contained 120 mM Na+, 10 mM Ca2+ and 2 mM Mg2+.