
Figure 6. Effect of dialysing DRG neurones with BAPTA or CI on desensitization of capsaicin-activated current.
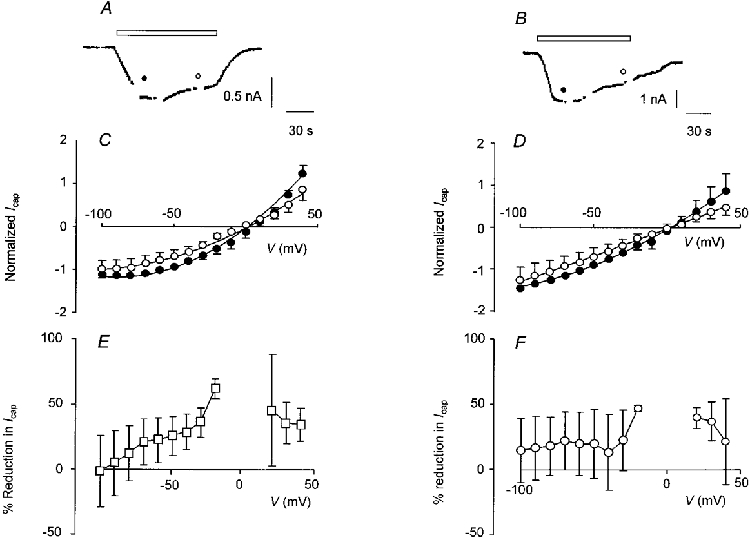
Typical recordings of capsaicin-activated current from a BAPTA-loaded cell (A) and from a CI-loaded cell (B). Capsaicin (0.5 μM) was applied as indicated by the open bars. In both A and B, I-V curves were constructed about 30 s, 1 min and 2 min from the start of the application as indicated by the breaks in the trace; Vh was -60 mV. C, I-V relationship for capsaicin-activated current recorded in cells dialysed with BAPTA (10 mM, n = 7). D, I-V curves for capsaicin-activated current recorded in CI (100 μM)-loaded cells (n = 3). In both C and D, I-V curves constructed after 30 s (•) and 2 min (^) are shown; points are joined by a curve fitted after omitting data from potentials between -20 and +10 mV, although in each case all points have been plotted. Current was normalized to the inward current after 30 s at a Vh of -60 mV; points are means ±s.e.m.E, plot of percentage reduction in capsaicin-activated current after 120 s against Vh for cells dialysed with BAPTA (10 mM, n = 7). F, plot of percentage reduction in capsaicin-activated current after 120 s for CI (100 μM)-loaded cells (n = 3). In both E and F points are means ±s.e.m.