
Figure 5. The kinetic responses of V̇p,O2 and [PCr] to a constant-load change in work rate in six subjects.
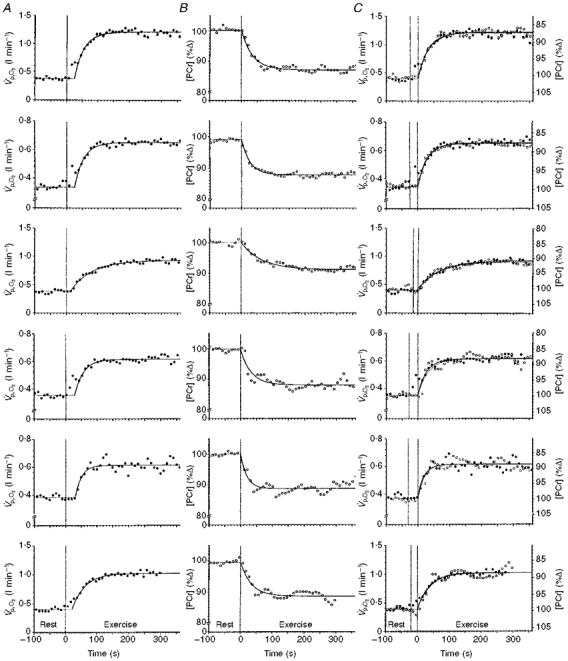
A shows V̇p,O2 with the φII response fitted by a monoexponential. B shows the simultaneously determined [PCr] response. C shows the identity of φII V̇p,O2 (•) and [PCr] (^) kinetics determined simultaneously during quadriceps exercise. The [PCr] scale has been inverted to facilitate kinetic comparisons. Graphs from top to bottom show data from subjects 1 to 6, respectively.