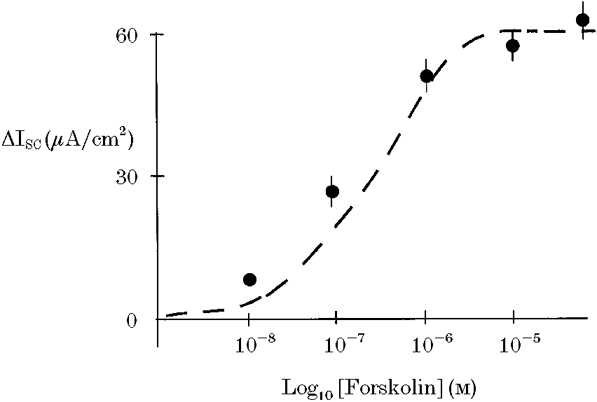
Figure 2. Concentration-response relationship for the effect of forskolin on ISC.

Maximal response to forskolin was obtained at a concentration of 10 μM. Dashed lines show the best-fit curve for an equation analagous to the Michaelis-Menten equation.
