
Figure 1. The inhibitory effect of high FMRFamide concentration on whole cell and isolated patch responses to FMRFamide.
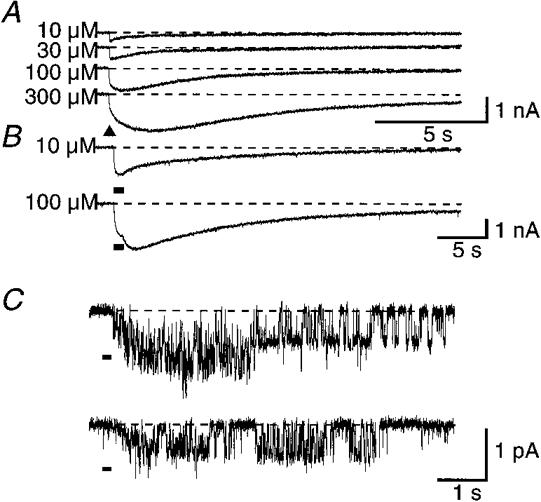
A, whole cell current responses to short 10 ms pressure ejection pulses of 10, 30, 100, or 300 μM FMRFamide applied to the same F2 neurone. The biphasic activation phase was not as pronounced in all recordings. B, whole cell responses to long (1 s) applications of 10 μM, or 100 μM FMRFamide in the same F2 neurone. C, unitary current responses to 100 ms pressure applications of 1 mM FMRFamide to an isolated outside-out patch from the C2 neurone. The holding potential was −60 mV for A and B, and −100 mV for C. ▴ or black bars under the traces denote applications of FMRFamide. Dashed lines indicate the base current level in each case.