
Figure 2. Unitary currents activated by different FMRFamide or WnLRFamide concentrations in outside-out patches.
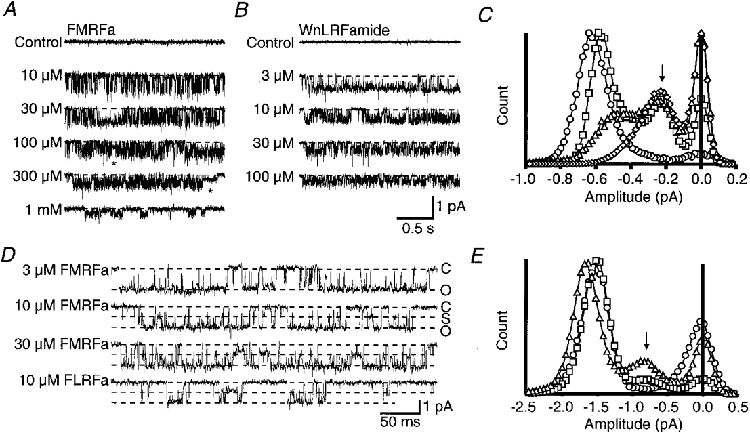
Recordings in A and D are from neuronal patches whilst those in B are from oocyte patches. A, example traces of steady-state activity recorded in a patch from the C2 neurone in the presence of a range of FMRFamide concentrations from 10 μM to 1 mM. The asterisk highlights two examples of unusually long sojourns at a subconductance level. B, example traces of steady-state activity of FaNaC in oocyte patches in the presence of a range of WnLRFamide concentrations from 3 to 100 μM. C, all-point amplitude histograms prepared from the recordings in B. The symbols used are 3 μM (^), 10 μM (□), 30 μM (▵), 100 μM (⋄) WnLRFamide. D, unitary currents activated by 3, 10, or 30 μM FMRFamide, or 10 μM FLRFamide in the presence of external solution containing 260 mM Na+ and 1 mM Ca2+. These records were filtered at 2 kHz. E, amplitude histograms for unitary current recordings under the same conditions as D in the presence of 3 μM (^), 10 μM (□), or 30 μM (▵) FMRFamide. The peaks due to the subconductance level are marked with an arrow in C and E. At least 20 s of recording was used in each case to construct the amplitude histograms. All traces were obtained at a holding potential of −100 mV. The dashed lines superimposed on the traces show the fully closed level (C) in A, B and D, and in D they also mark the fully prominent subconductance level (S) and the fully open level (O).