
Figure 3. Comparison of flickering induced by different FMRFamide-related agonists in neuronal patches.
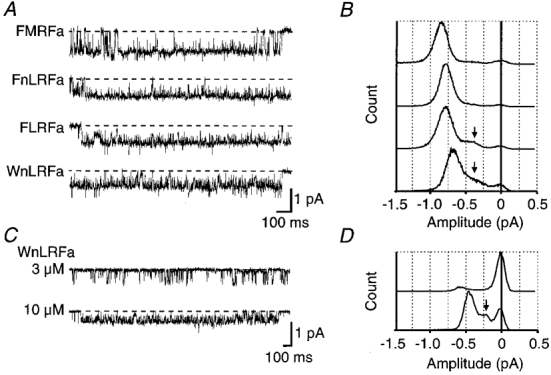
A, traces show flickering during prolonged openings recorded from a single patch in the presence of 10 μM FMRFamide, FnLRFamide, FLRFamide, or WnLRFamide. Dashed lines indicate the fully closed level. Corresponding all-point amplitude histograms are shown opposite in B. C, traces show activation of smaller amplitude unitary currents in a different neuronal patch by either 3 or 10 μM WnLRFamide. The corresponding amplitude histograms are shown in D. In B and D the subconductance level is indicated by an arrow.