
Figure 4. Voltage dependence of the effect of WnLRFamide.
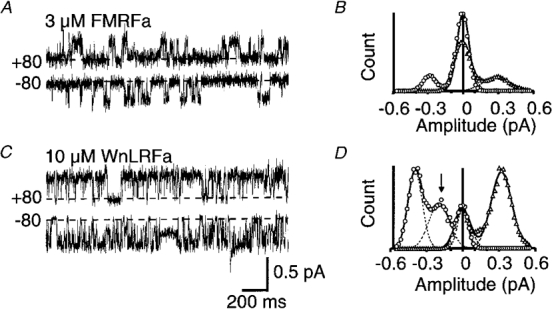
Recordings in this figure were obtained in the presence of symmetrical high sodium from oocytes at holding potentials of +80 mV (▵) or −80 mV (^). The dashed line in each case indicates the fully closed level. A and C, respectively, show traces for 3 μM FMRFamide or 10 μM WnLRFamide applied to two different patches, whilst the corresponding amplitude histograms, constructed from ≥ 5 s of recording in each case, are shown in B and D. An arrow highlights the subconductance seen in the presence of WnLRFamide at negative holding potentials. Individual Gaussian functions and the combined curves fitted to the data are shown by dashed and continuous lines, respectively, in B and D.