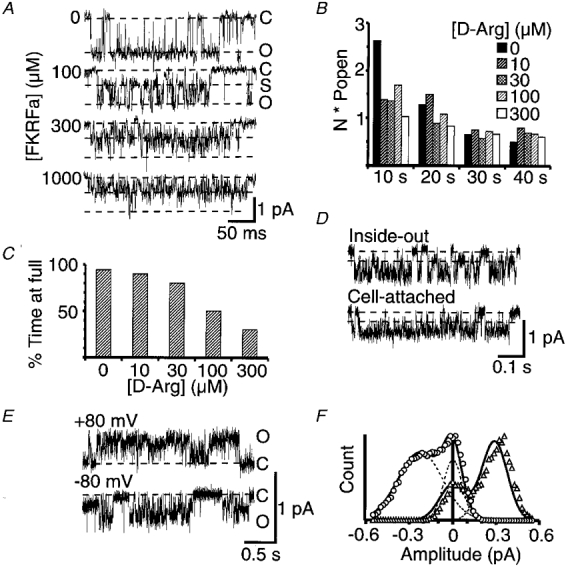
Figure 5. Inhibitory effects of FKRFamide and FM(D)RFamide (D-Arg).

Data in A-D are from neuronal patches, whilst E and F show data from oocyte patches expressing FaNaC. A, unitary currents activated by 3 μM FMRFamide in the presence of 0 μM, 100 μM, 300 μM, or 1 mM FKRFamide. The external solution contained 260 mM Na+ and 1 mM Ca2+ and the recordings were filtered at 2 kHz. Dashed lines indicate the fully closed level (C), the prominent subconductance level (S), and the fully open level (O). The holding potential was −100 mV. B, mean NPopen data from 3 experiments estimated over 10 s time periods after the starting application of each test solution. All solutions contained 3 μM FMRFamide in combination with 0, 10, 30, 100, or 300 μM D-Arg. C, concentration dependence of the blocking effect of D-Arg estimated from the percentage time spent at the full conductance level during long events with only partial closings. D, traces show flickery bursts of openings and the presence of substates also occurring in recordings from inside-out and cell-attached patches from the C2 neurone. The inside-out patch was held at −100 mV membrane potential while the cell-attached patch was held 80 mV hyperpolarized from the cell resting potential. The recording electrode contained 1 μM FMRFamide and 100 μM FKRFamide, in each case dissolved in the standard extracellular solution, and the inside-out patch was perfused with the standard intracellular type solution used in the recording pipette for outside-out patches. Dashed lines indicate the fully closed level, and the prominent subconductance level. Traces in E show unitary currents in an oocyte patch activated by 3 μM FMRFamide in the presence of 300 μM FKRFamide under conditions of symmetrical high sodium, and at holding potentials of +80 or −80 mV (denoted by ▵ or ^, respectively, in F). The corresponding amplitude histograms constructed from ≥ 5 s sections of recording are shown in F, with individual Gaussian functions and the combined curves fitted to the data shown by dashed and continuous lines, respectively.
