
Figure 6. Comparison of the effects of some FMRFamide analogues and other substances.
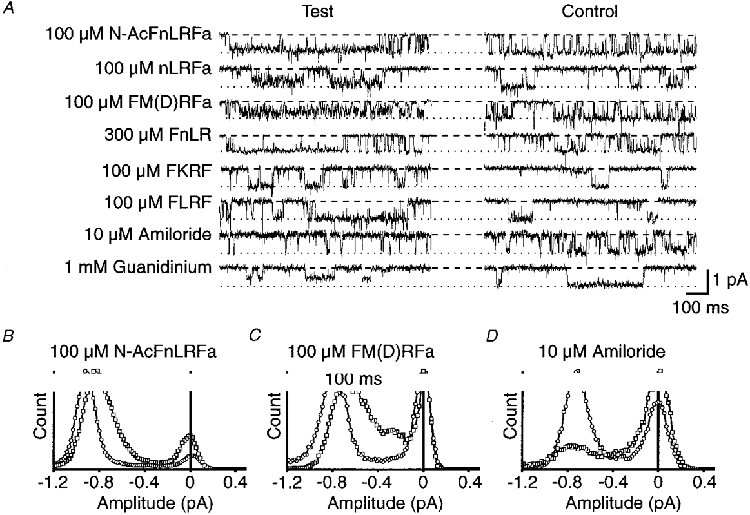
A, in each case control traces are in the presence of 3 μM FMRFamide alone, and test traces are with simultaneous application of N-AcFnLRFamide, nLRFamide, FM(D)RFamide, FKRF, FLRF (all 100 μM), 300 μM FnLR, 10 μM amiloride, or 1 mM guanidinium. The holding potential was −100 mV in each case, and a dashed line and dotted line, respectively, indicate the base and unitary current levels in the presence of 3 μM FMRFamide only. B, C and D show amplitude histograms obtained in three separate patches from ≥ 15 s of recording, in the presence of 3 μM FMRFamide alone (^), or with the additional presence of 100 μM Ac-FnLRFamide, 100 μM FM(D)RFamide, or 10 μM amiloride (□).