
Figure 2. Responses of motor cortex neurones to single pulse stimulation of the SR nerve and the palmar branch of the UL nerve in the contralateral forelimb during quiet rest.
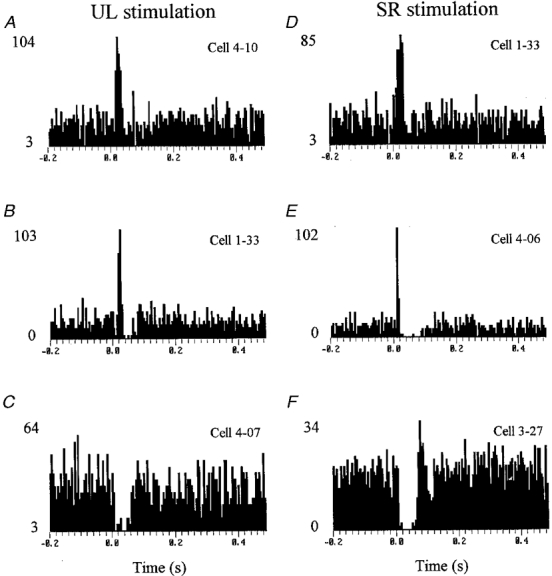
Stimulus delivered at time zero in each histogram. Stimulus intensity in each case was 1.5 times threshold for the most excitable fibres in the nerve. A and D show excitatory responses to UL and SR stimulation, respectively (from 2 different neurones). B and E show responses to stimulation of each nerve in which the initial facilitation was followed by a reduction in discharge rate. C and F show responses that began with a decrease in firing rate (followed in F by an increase). Note that B and D show responses from the same cell to stimulation of each nerve. Numbers to the left of each histogram indicate discharge rate (impulses s−1) at baseline and peak (divide by 200 to obtain number of spikes bin−1 stimulus−1). Bin width in all cases, 5 ms.