
Figure 3. Response amplitudes in the resting animal.
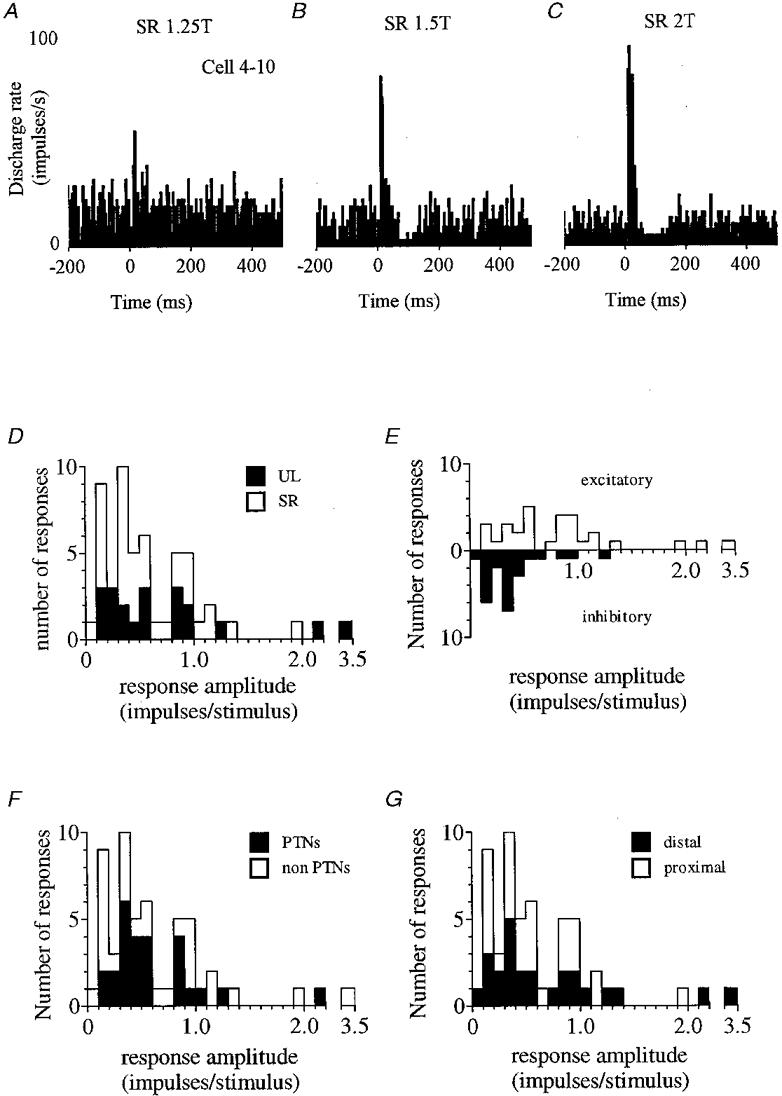
A-C show the initial excitatory response of a neurone undergoing a graded increase in size as stimulus intensity increased. Note in B and C the appearance of a subsequent decrease in firing. D-G illustrate amplitude distributions for all responses (n = 54) divided according to whether responses were to UL or SR stimulation (D), excitatory or inhibitory (E), obtained from PTNs or non-PTNs (F), and from cells which had a distal or proximal receptive field (G).