
Figure 4. Step phase dependency in responsiveness to nerve stimulation during locomotion.
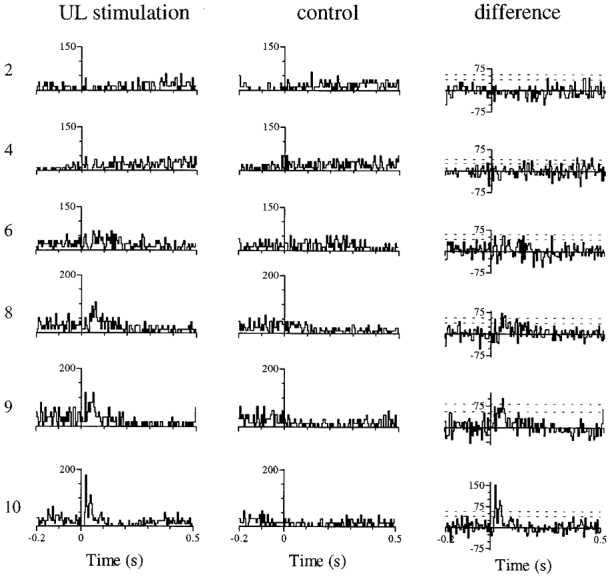
Responses of a fast axon PTN (with a peripheral receptive field on the contralateral forepaw) to UL stimulation in different tenths (2, 4, 6, 8, 9 and 10) of the step cycle are shown on the left. Note that onset of triceps activity occurs at the end of tenth 10, so that the stance phase of the step cycle begins at the start of tenth 1. Delivery of ‘mock’ stimuli (monitor pulse only) generates an equivalent control histogram (centre) for each of the responses, in which the same step-related rhythmicity of the cell is evident. Subtraction of a control histogram from its corresponding response histogram produces a difference histogram (right) in which the response to nerve stimulation is isolated. Horizontal dashed lines in difference histograms are at 2 and 3 s.d. above mean rate during the 200 ms pre-stimulus period (for further details, see Methods). Time axis at the bottom of each column applies to all histograms above (stimuli delivered at time zero in response histograms). Vertical axis is discharge rate (left and centre) and difference in rate (right) in impulses per second.