
Figure 5. Step phase dependency of response did not occur in parallel with any step cycle-related variation in amplitude of the NCAP.
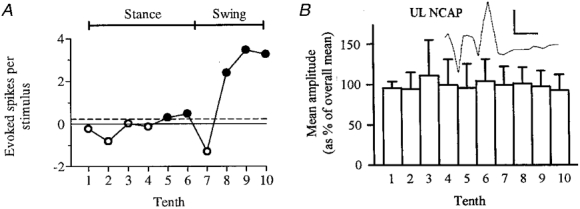
The step phase-dependent changes in response size illustrated in Fig. 4 and summarized in A did not correlate with small variations in NCAP amplitude at different times in the step cycle (B). Response size in each tenth, in evoked spikes per stimulus, was obtained from the appropriate difference histogram as described in Methods. Filled circles in A indicate statistically significant modulations; open circles indicate modulations which did not exceed significance criteria. The horizontal dashed line indicates the response size during rest. B shows the mean amplitude for the UL NCAP recorded simultaneously with the neuronal responses. Error bars show s.d. Inset shows the averaged NCAP (preceded by stimulus artifact, see Fig. 1C). Scale bars are 1 ms and 0.2 mV.