
Figure 6. An inhibitory response to SR stimulation.
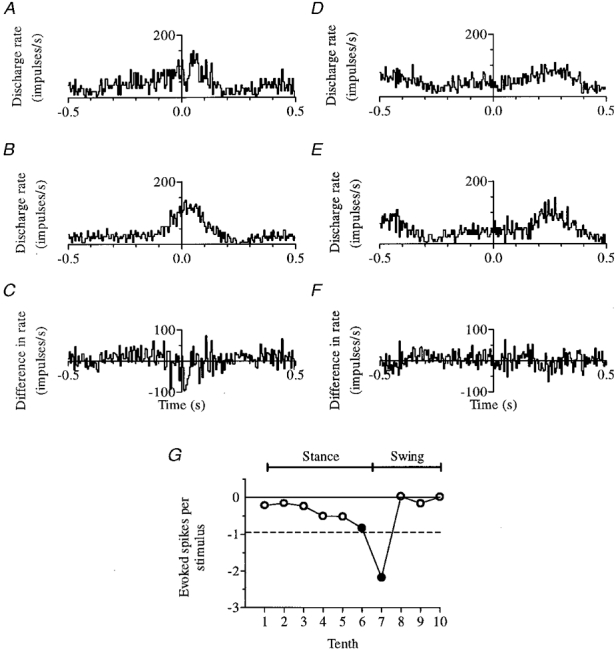
The effect of stimuli delivered early in the swing phase (tenth 7) is shown in A-C, and lack of significant modulation when stimuli were delivered in mid-stance (tenth 4) is shown for comparison in D-F. In each case, response histograms are shown at the top (A and D), control histograms in the centre (B and E) and difference histograms at the bottom (C and F, which are A - B and D - E, respectively). G summarizes for this non-PTN the step phase dependency of SR inhibition (conventions as in Fig. 5A).