
Figure 8. Significant responsiveness to nerve stimulation across a broad portion of the step cycle.
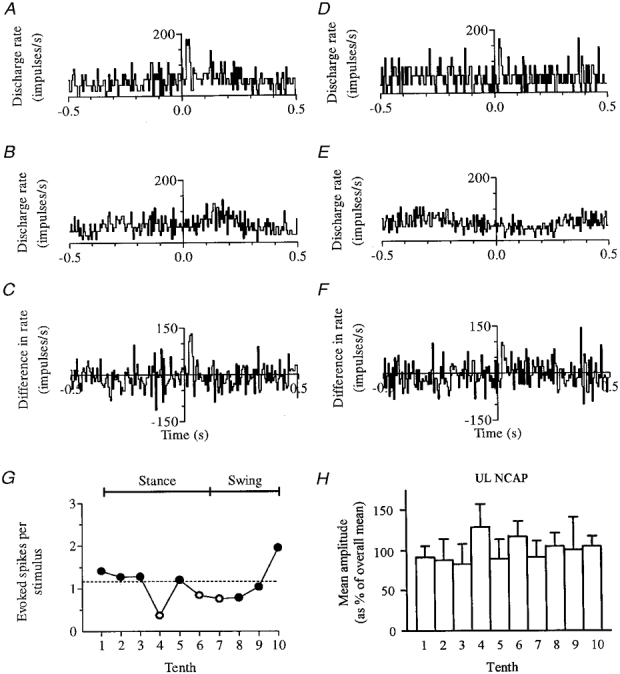
The effect on this fast axon PTN of stimuli delivered at the end of swing (tenth 10) is shown in A-C, and the effect of stimuli delivered in the second half of stance (tenth 5) is shown in D-F; step phase dependence is summarized in G. All conventions as in Fig. 6. Variation in NCAP amplitude at different times in the step cycle is shown in H (conventions as in Fig. 5B). Note that the maximum and minimum responsiveness of the cell (tenths 10 and 4, respectively) are not matched by a parallel increase and decrease in NCAP amplitude.