
Figure 10. Frequency distributions showing the proportion of neurones with peak step-related firing in each tenth of the step cycle, and step tenths in which neuronal activity was affected by nerve stimulation.
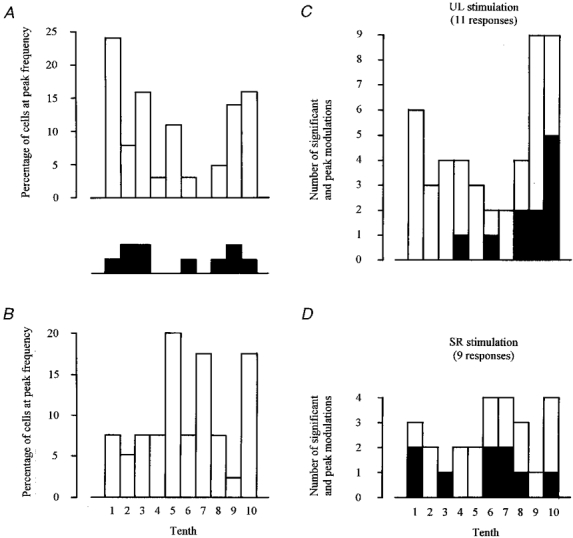
A includes all 37 neurones responding in the resting animal to stimulation of one or both nerves. B includes 40 of the 46 neurones unresponsive to nerve stimulation in the resting animal (the 6 other neurones did not discharge rhythmically during ladder walking). Step phase dependency was studied in 13 cells, 10 of which fired rhythmically during walking. The step tenth in which each of these reached peak discharge rate is indicated (filled squares) in the inset between A and B. C and D show, for UL and SR stimulation, respectively, step tenths in which neuronal activity was significantly (open bars) and most (filled bars) affected.