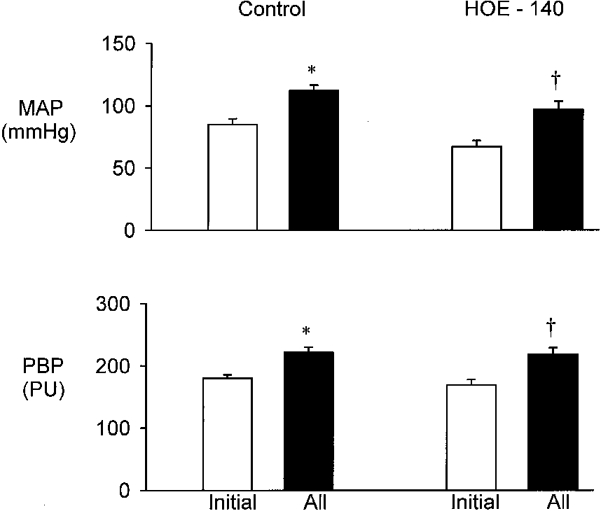
Figure 3. Effect of i.v. infusion of HOE-140 (120 mg kg−1 min−1) on responses to i.v. infusion of AII at 300 ng kg−1 min−1.

Top, MAP. Bottom, renal PBP. Results are means ± s.e.m., n = 8. * P < 0.001 compared with initial control value; † P < 0.001 compared with initial HOE-140 value.
