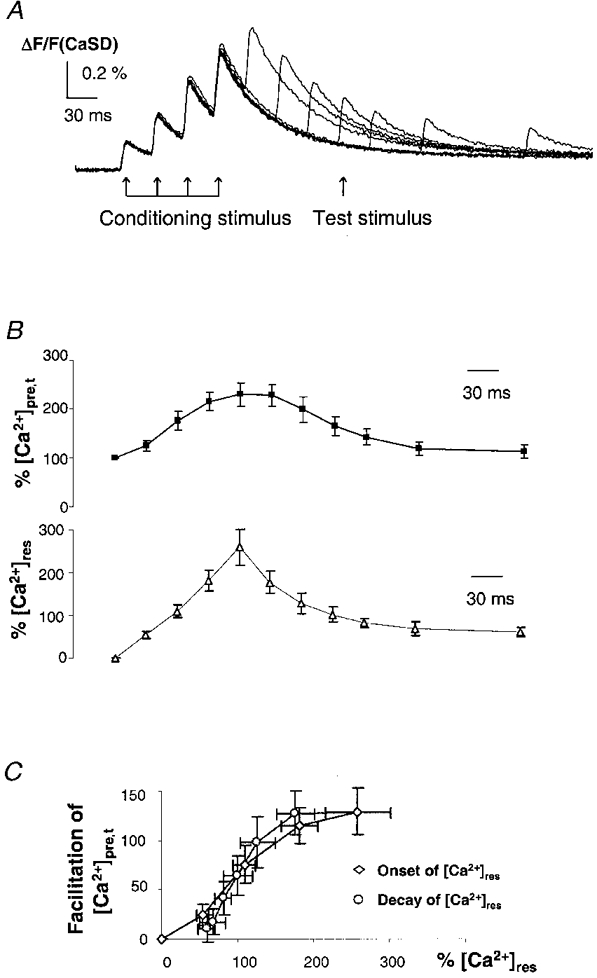
Figure 5. Recovery time course of [Ca2+]pre,t facilitation.

A, [Ca2+]pre,t from a typical experiment to measure the time course of recovery from facilitation of [Ca2+]pre,t. Following the conditioning stimulation train, a single test stimulus was applied at various intervals. B, summary data to show the time course of [Ca2+]pre,t facilitation and [Ca2+]res (n = 8). The recovery is represented by the [Ca2+]pre,t in response to the test stimulus after the conditioning stimulation, which was measured after subtracting the decay time course of residual Ca2+ traces ([Ca2+]res). By visual inspection, the recovery time course for the facilitation appears similar to the decay of the [Ca2+]res. This suggests that the suppression of K+ currents is related to the [Ca2+]res. C, relationship between facilitation of [Ca2+]pre,t and normalized [Ca2+]res during conditioning stimulation and testing. The onset and decay phases of [Ca2+]res exhibit a slightly different relationship with [Ca2+]pre,t. This difference may reflect a small amount of cumulative voltage-dependent modulation during the conditioning stimulation.
